Extrapolate values in Pandas DataFrame
Extrapolating Pandas DataFrames
DataFrames maybe be extrapolated, however, there is not a simple method call within pandas and requires another library (e.g. scipy.optimize).
Extrapolating
Extrapolating, in general, requires one to make certain assumptions about the data being extrapolated. One way is by curve fitting some general parameterized equation to the data to find parameter values that best describe the existing data, which is then used to calculate values that extend beyond the range of this data. The difficult and limiting issue with this approach is that some assumption about trend must be made when the parameterized equation is selected. This can be found thru trial and error with different equations to give the desired result or it can sometimes be inferred from the source of the data. The data provided in the question is really not large enough of a dataset to obtain a well fit curve; however, it is good enough for illustration.
The following is an example of extrapolating the DataFrame with a 3rd order polynomial
f(x) = a x3 + b x2 + c x + d (Eq. 1)
This generic function (func()) is curve fit onto each column to obtain unique column specific parameters (i.e. a, b, c, d). Then these parameterized equations are used to extrapolate the data in each column for all the indexes with NaNs.
import pandas as pd
from cStringIO import StringIO
from scipy.optimize import curve_fit

df = pd.read_table(StringIO('''
                neg       neu       pos       avg
    0           NaN       NaN       NaN       NaN
    250    0.508475  0.527027  0.641292  0.558931
    500         NaN       NaN       NaN       NaN
    1000   0.650000  0.571429  0.653983  0.625137
    2000        NaN       NaN       NaN       NaN
    3000   0.619718  0.663158  0.665468  0.649448
    4000        NaN       NaN       NaN       NaN
    6000        NaN       NaN       NaN       NaN
    8000        NaN       NaN       NaN       NaN
    10000       NaN       NaN       NaN       NaN
    20000       NaN       NaN       NaN       NaN
    30000       NaN       NaN       NaN       NaN
    50000       NaN       NaN       NaN       NaN'''), sep='\s+')

# Do the original interpolation
df.interpolate(method='nearest', xis=0, inplace=True)

# Display result
print ('Interpolated data:')
print (df)
print ()

# Function to curve fit to the data
def func(x, a, b, c, d):
    return a * (x ** 3) + b * (x ** 2) + c * x + d

# Initial parameter guess, just to kick off the optimization
guess = (0.5, 0.5, 0.5, 0.5)

# Create copy of data to remove NaNs for curve fitting
fit_df = df.dropna()

# Place to store function parameters for each column
col_params = {}

# Curve fit each column
for col in fit_df.columns:
    # Get x & y
    x = fit_df.index.astype(float).values
    y = fit_df[col].values
    # Curve fit column and get curve parameters
    params = curve_fit(func, x, y, guess)
    # Store optimized parameters
    col_params[col] = params[0]

# Extrapolate each column
for col in df.columns:
    # Get the index values for NaNs in the column
    x = df[pd.isnull(df[col])].index.astype(float).values
    # Extrapolate those points with the fitted function
    df[col][x] = func(x, *col_params[col])

# Display result
print ('Extrapolated data:')
print (df)
print ()

print ('Data was extrapolated with these column functions:')
for col in col_params:
    print ('f_{}(x) = {:0.3e} x^3 + {:0.3e} x^2 + {:0.4f} x + {:0.4f}'.format(col, *col_params[col]))
Extrapolating Results
Interpolated data:
            neg       neu       pos       avg
0           NaN       NaN       NaN       NaN
250    0.508475  0.527027  0.641292  0.558931
500    0.508475  0.527027  0.641292  0.558931
1000   0.650000  0.571429  0.653983  0.625137
2000   0.650000  0.571429  0.653983  0.625137
3000   0.619718  0.663158  0.665468  0.649448
4000        NaN       NaN       NaN       NaN
6000        NaN       NaN       NaN       NaN
8000        NaN       NaN       NaN       NaN
10000       NaN       NaN       NaN       NaN
20000       NaN       NaN       NaN       NaN
30000       NaN       NaN       NaN       NaN
50000       NaN       NaN       NaN       NaN

Extrapolated data:
               neg          neu         pos          avg
0         0.411206     0.486983    0.631233     0.509807
250       0.508475     0.527027    0.641292     0.558931
500       0.508475     0.527027    0.641292     0.558931
1000      0.650000     0.571429    0.653983     0.625137
2000      0.650000     0.571429    0.653983     0.625137
3000      0.619718     0.663158    0.665468     0.649448
4000      0.621036     0.969232    0.708464     0.766245
6000      1.197762     2.799529    0.991552     1.662954
8000      3.281869     7.191776    1.702860     4.058855
10000     7.767992    15.272849    3.041316     8.694096
20000    97.540944   150.451269   26.103320    91.365599
30000   381.559069   546.881749   94.683310   341.042883
50000  1979.646859  2686.936912  467.861511  1711.489069

Data was extrapolated with these column functions:
f_neg(x) = 1.864e-11 x^3 + -1.471e-07 x^2 + 0.0003 x + 0.4112
f_neu(x) = 2.348e-11 x^3 + -1.023e-07 x^2 + 0.0002 x + 0.4870
f_avg(x) = 1.542e-11 x^3 + -9.016e-08 x^2 + 0.0002 x + 0.5098
f_pos(x) = 4.144e-12 x^3 + -2.107e-08 x^2 + 0.0000 x + 0.6312
Plot for avg column
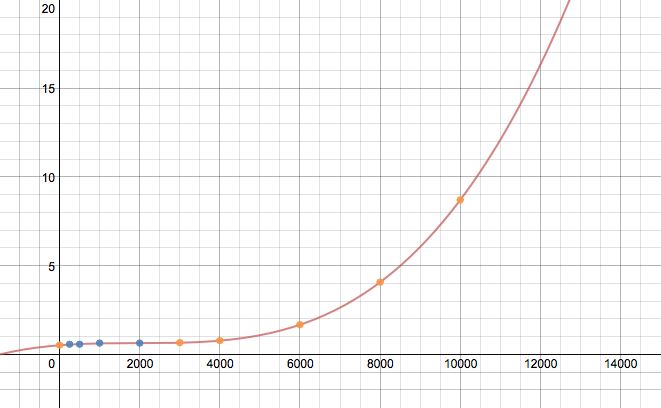
Without a larger dataset or knowing the source of the data, this result maybe completely wrong, but should exemplify the process to extrapolate a DataFrame. The assumed equation in func() would probably need to be played with to get the correct extrapolation. Also, no attempt to make the code efficient was made.
Update:
If your index is non-numeric, like a DatetimeIndex, see this answer for how to extrapolate them.
linearly extrapolate pandas dataframe using built-in interpolate method
You can use scipy interpolate method directly in pandas. See pandas.DataFrame.interpolate documentation, you can use in method option techniques from scipy.interpolate.interp1d as it's noted in the attached link.
Solution for your example could look like:
df.interpolate(method="slinear", fill_value="extrapolate", limit_direction="both")

# Out:
#      0
# 0 -7.0
# 1 -3.0
# 2  1.0
# 3  5.0
# 4  5.5
# 5  6.0
# 6  6.1
# 7  6.2
# 8  6.3
You can then easily select any values you are interested in, e.g. df_interpolated.loc[x] (where df_interpolated is output of the previous code block) using indexes defined in your question by x variable.
Explanation:
method="slinear"- one of the method listed in pandas doc above that is passed to scipyinterp1d(see e.g. this link)fill_value="extrapolate"- pass any option allowed by scipy (here extrapolate which is exactly what you want)limit_direction="both"- to get extrapolation in both direction (otherwise default would be set to "forward" in that case and you would seenp.nanfor the first two values)
Linear extrapolation in dataframes
I did something similar a while ago. It isn't super pretty, but maybe you can use it. As an example I'm using the following DataFrame (modified version of your second example):
         value
year
2009       NaN
2010       NaN
2011       NaN
2012  320700.0
2013  315300.0
2014  310500.0
2015  307500.0
2016  315400.0
2017       NaN
2018       NaN
2019       NaN
year is the index!
The 1. step is filling up the end piece of NaNs:
increment = df.value.diff(1).mean()
idx_max_notna = df.value[df.value.notna()].index.array[-1]
idx = df.index[df.index >= idx_max_notna]
df.value[idx] = df.value[idx].fillna(increment).cumsum()
Result:
         value
year
2009       NaN
2010       NaN
2011       NaN
2012  320700.0
2013  315300.0
2014  310500.0
2015  307500.0
2016  315400.0
2017  314075.0
2018  312750.0
2019  311425.0
As increment I've used the mean of the existing diffs. If you want to use the last diff then replace it with:
increment = df.value.diff(1)[df.value.notna()].array[-1]
The 2. step of filling up the start piece of NaNs is more or less the same, just with the column value reversed, and at the end re-reversed:
df.value = df.value.array[::-1]
increment = df.value.diff(1).mean()
idx_max_notna = df.value[df.value.notna()].index.array[-1]
idx = df.index[df.index >= idx_max_notna]
df.value[idx] = df.value[idx].fillna(increment).cumsum()
df.value = df.value.array[::-1]
Result:
         value
year
2009  324675.0
2010  323350.0
2011  322025.0
2012  320700.0
2013  315300.0
2014  310500.0
2015  307500.0
2016  315400.0
2017  314075.0
2018  312750.0
2019  311425.0
Important: The method assumes that there is no gap in the index (missing year).
As I said, not very pretty, but it worked for me.
(PS: Just to clarify the use of 'similar' above: This is indeed linear extrapolation.)
EDIT
Sample frame (the first 3 rows of the frame in the screenshot):
n2hn_df = pd.DataFrame(
        {'2010': [134.024, np.NaN, 36.711], '2011': [134.949, np.NaN, 41.6533],
         '2012': [128.193, np.NaN, 33.4578], '2013': [125.131, np.NaN, 33.4578],
         '2014': [122.241, np.NaN, 33.6356], '2015': [115.301, np.NaN, 35.5919],
         '2016': [108.927, 520.38, 40.1008], '2017': [106.101, 523.389, 41.38],
         '2018': [96.1861, 526.139, 49.0906], '2019': [np.NaN, np.NaN, np.NaN]},
        index=pd.Index(data=['AT', 'BE', 'BG'], name='NUTS_ID')
    )
            2010      2011      2012  ...     2017      2018  2019
NUTS_ID                               ...
AT       134.024  134.9490  128.1930  ...  106.101   96.1861   NaN
BE           NaN       NaN       NaN  ...  523.389  526.1390   NaN
BG        36.711   41.6533   33.4578  ...   41.380   49.0906   NaN
Extrapolation:
# Transposing frame
n2hn_df = n2hn_df.T
for col in n2hn_df.columns:
    # Extract column
    ser = n2hn_df[col].copy()

    # End piece
    increment = ser.diff(1).mean()
    idx_max_notna = ser[ser.notna()].index.array[-1]
    idx = ser.index[ser.index >= idx_max_notna]
    ser[idx] = ser[idx].fillna(increment).cumsum()

    # Start piece
    ser = pd.Series(ser.array[::-1])
    increment = ser.diff(1).mean()
    idx_max_notna = ser[ser.notna()].index.array[-1]
    idx = ser.index[ser.index >= idx_max_notna]
    ser[idx] = ser[idx].fillna(increment).cumsum()
    n2hn_df[col] = ser.array[::-1]

# Re-transposing frame
n2hn_df = n2hn_df.T
Result:
            2010      2011      2012  ...     2017      2018        2019
NUTS_ID                               ...
AT       134.024  134.9490  128.1930  ...  106.101   96.1861   91.456362
BE       503.103  505.9825  508.8620  ...  523.389  526.1390  529.018500
BG        36.711   41.6533   33.4578  ...   41.380   49.0906   50.638050
How to extrapolate missing values with groupby - Python?
You can modify the linked answer as follows:
def extrapolate(df):
    new_max = df.index.max() + pd.to_timedelta('30D')
    dates = pd.date_range(df.index.min(), new_max, freq='D')
    ret_df = df.reindex(dates)

    x = np.arange(len(df))

    # new x values
    new_x = pd.Series(np.arange(len(ret_df)), index=dates)

    for col in df.columns:
        fit = np.polyfit(x, df[col], 1)

        # tranform and fill
        ret_df[col].fillna(fit[0]*new_x + fit[1], inplace=True)

    return ret_df
and then apply:
ext_cols = ['value_1', 'value_2']

df.groupby('account_id')[ext_cols].apply(extrapolate)
You can also specify the polynomial orders for each column:
poly_orders = [1,2]
ext_cols = ['value_1', 'value_2']

def extrapolate(df):
    new_max = df.index.max() + pd.to_timedelta('30D')
    dates = pd.date_range(df.index.min(), new_max, freq='D')
    ret_df = df.reindex(dates)

    x = np.arange(len(df))

    # new x values
    new_x = pd.Series(np.arange(len(ret_df)), index=dates)

    for col, o in zip(ext_cols, poly_orders):
        fit = np.polyfit(x, df[col], o)

        print(fit)

        # tranform and fill
        new_vals = pd.Series(0, index=dates)

        for i in range(1,o+1):
            new_vals = new_x**i * fit[o-i]

        ret_df[col].fillna(new_vals, inplace=True)

    return ret_df
And use sklearn.linear_model.LinearRegression for better manipulation of input/output instead of numpy.polyfit.
pandas extrapolation of polynomial
"With the same elegance" is a somewhat tall order but this can be done. As far as I'm aware you'll need to compute the extrapolated values manually. Note it is very unlikely these values will be very meaningful unless the data you are operating on actually obey a law of the form of the interpolant.
For example, since you requested a second degree polynomial fit:
import numpy as np
t = df["time"]
dat = df["data"]
p = np.poly1d(np.polyfit(t,data,2))
Now p(t) is the value of the best-fit polynomial at time t.
Related Topics
Does Python Have a Stack/Heap and How Is Memory Managed
Making Heatmap from Pandas Dataframe
Convert Columns to String in Pandas
Convert a List with Strings All to Lowercase or Uppercase
On Localhost, How to Pick a Free Port Number
Conda Command Is Not Recognized on Windows 10
How to Get a Complete List of Object's Methods and Attributes
How to Manage Third-Party Python Libraries with Google App Engine? (Virtualenv? Pip)
Check If a Number Is Int or Float
Why am I Getting Importerror: No Module Named Pip ' Right After Installing Pip
How to Write a File or Data to an S3 Object Using Boto3
Salt and Hash a Password in Python
Python Eval: Is It Still Dangerous If I Disable Builtins and Attribute Access
Selenium: Firefoxprofile Exception Can't Load the Profile
Cannot Pass an Argument to Python with "#!/Usr/Bin/Env Python"
How to Check If a Value Is in the List in Selection from Pandas Data Frame
Python Lookup Hostname from Ip with 1 Second Timeout
What's the Difference Between Str.Isdigit, Isnumeric and Isdecimal in Python