Limit jvm process memory on ubuntu
You can't control what you want to control, -Xmx only controls the Java Heap, it doesn't control consumption of native memory by the JVM, which is consumed completely differently based on implementation.
From the following article Thanks for the Memory ( Understanding How the JVM uses Native Memory on Windows and Linux )
Maintaining the heap and garbage collector use native memory you can't control.
More native memory is required to maintain the state of the
memory-management system maintaining the Java heap. Data structures
must be allocated to track free storage and record progress when
collecting garbage. The exact size and nature of these data structures
varies with implementation, but many are proportional to the size of
the heap.
and the JIT compiler uses native memory just like javac would
Bytecode compilation uses native memory (in the same way that a static
compiler such as gcc requires memory to run), but both the input (the
bytecode) and the output (the executable code) from the JIT must also
be stored in native memory. Java applications that contain many
JIT-compiled methods use more native memory than smaller applications.
and then you have the classloader(s) which use native memory
Java applications are composed of classes that define object structure
and method logic. They also use classes from the Java runtime class
libraries (such as java.lang.String) and may use third-party
libraries. These classes need to be stored in memory for as long as
they are being used. How classes are stored varies by implementation.
I won't even start quoting the section on Threads, I think you get the idea that-Xmx doesn't control what you think it controls, it controls the JVM heap, not everything
goes in the JVM heap, and the heap takes up way more native memory that what you specify for
management and book keeping.
How to set the maximum memory usage for JVM?
use the arguments -Xms<memory> -Xmx<memory>. Use M or G after the numbers for indicating Megs and Gigs of bytes respectively. -Xms indicates the minimum and -Xmx the maximum.
Java process memory is much bigger than specified limits
Plain and simple the JVM uses more memory than what is supplied in -Xms and -Xmx and the other command line parameters.
Here is a very detailed article on how the JVM allocates and manages memory, it isn't as simple as what you are expected based on your assumptions in your question, it is well worth a comprehensive read.
ThreadStack size in many implementations have minimum limits that vary by Operating System and sometimes JVM version; the threadstack setting is ignored if you set the limit below the native OS limit for the JVM or the OS ( ulimit on *nix has to be set instead sometimes ). Other command line options work the same way, silently defaulting to higher values when too small values are supplied. Don't assume that all the values passed in represent what are actually used.
The Classloaders, and Tomcat has more than one, eat up lots of memory that isn't documented easily. The JIT eats up a lot of memory, trading space for time, which is a good trade off most of the time.
The numbers you cite are pretty close to what I would expect.
Java using much more memory than heap size (or size correctly Docker memory limit)
Virtual memory used by a Java process extends far beyond just Java Heap. You know, JVM includes many subsytems: Garbage Collector, Class Loading, JIT compilers etc., and all these subsystems require certain amount of RAM to function.
JVM is not the only consumer of RAM. Native libraries (including standard Java Class Library) may also allocate native memory. And this won't be even visible to Native Memory Tracking. Java application itself can also use off-heap memory by means of direct ByteBuffers.
So what takes memory in a Java process?
JVM parts (mostly shown by Native Memory Tracking)
- Java Heap
The most obvious part. This is where Java objects live. Heap takes up to -Xmx amount of memory.
- Garbage Collector
GC structures and algorithms require additional memory for heap management. These structures are Mark Bitmap, Mark Stack (for traversing object graph), Remembered Sets (for recording inter-region references) and others. Some of them are directly tunable, e.g. -XX:MarkStackSizeMax, others depend on heap layout, e.g. the larger are G1 regions (-XX:G1HeapRegionSize), the smaller are remembered sets.
GC memory overhead varies between GC algorithms. -XX:+UseSerialGC and -XX:+UseShenandoahGC have the smallest overhead. G1 or CMS may easily use around 10% of total heap size.
- Code Cache
Contains dynamically generated code: JIT-compiled methods, interpreter and run-time stubs. Its size is limited by -XX:ReservedCodeCacheSize (240M by default). Turn off -XX:-TieredCompilation to reduce the amount of compiled code and thus the Code Cache usage.
- Compiler
JIT compiler itself also requires memory to do its job. This can be reduced again by switching off Tiered Compilation or by reducing the number of compiler threads: -XX:CICompilerCount.
- Class loading
Class metadata (method bytecodes, symbols, constant pools, annotations etc.) is stored in off-heap area called Metaspace. The more classes are loaded - the more metaspace is used. Total usage can be limited by -XX:MaxMetaspaceSize (unlimited by default) and -XX:CompressedClassSpaceSize (1G by default).
- Symbol tables
Two main hashtables of the JVM: the Symbol table contains names, signatures, identifiers etc. and the String table contains references to interned strings. If Native Memory Tracking indicates significant memory usage by a String table, it probably means the application excessively calls String.intern.
- Threads
Thread stacks are also responsible for taking RAM. The stack size is controlled by -Xss. The default is 1M per thread, but fortunately the things are not so bad. OS allocates memory pages lazily, i.e. on the first use, so the actual memory usage will be much lower (typically 80-200 KB per thread stack). I wrote a script to estimate how much of RSS belongs to Java thread stacks.
There are other JVM parts that allocate native memory, but they do not usually play a big role in total memory consumption.
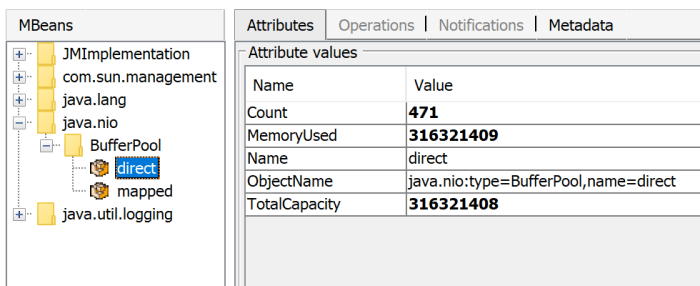
Direct buffers
An application may explicitly request off-heap memory by calling ByteBuffer.allocateDirect. The default off-heap limit is equal to -Xmx, but it can be overridden with -XX:MaxDirectMemorySize. Direct ByteBuffers are included in Other section of NMT output (or Internal before JDK 11).
The amount of used direct memory is visible through JMX, e.g. in JConsole or Java Mission Control:
Besides direct ByteBuffers there can be MappedByteBuffers - the files mapped to virtual memory of a process. NMT does not track them, however, MappedByteBuffers can also take physical memory. And there is no a simple way to limit how much they can take. You can just see the actual usage by looking at process memory map: pmap -x <pid>
Address           Kbytes    RSS    Dirty Mode  Mapping
...
00007f2b3e557000   39592   32956       0 r--s- some-file-17405-Index.db
00007f2b40c01000   39600   33092       0 r--s- some-file-17404-Index.db
                           ^^^^^               ^^^^^^^^^^^^^^^^^^^^^^^^
Native libraries
JNI code loaded by System.loadLibrary can allocate as much off-heap memory as it wants with no control from JVM side. This also concerns standard Java Class Library. In particular, unclosed Java resources may become a source of native memory leak. Typical examples are ZipInputStream or DirectoryStream.
JVMTI agents, in particular, jdwp debugging agent - can also cause excessive memory consumption.
This answer describes how to profile native memory allocations with async-profiler.
Allocator issues
A process typically requests native memory either directly from OS (by mmap system call) or by using malloc - standard libc allocator. In turn, malloc requests big chunks of memory from OS using mmap, and then manages these chunks according to its own allocation algorithm. The problem is - this algorithm can lead to fragmentation and excessive virtual memory usage.
jemalloc, an alternative allocator, often appears smarter than regular libc malloc, so switching to jemalloc may result in a smaller footprint for free.
Conclusion
There is no guaranteed way to estimate full memory usage of a Java process, because there are too many factors to consider.
Total memory = Heap + Code Cache + Metaspace + Symbol tables +
               Other JVM structures + Thread stacks +
               Direct buffers + Mapped files +
               Native Libraries + Malloc overhead + ...
It is possible to shrink or limit certain memory areas (like Code Cache) by JVM flags, but many others are out of JVM control at all.
One possible approach to setting Docker limits would be to watch the actual memory usage in a "normal" state of the process. There are tools and techniques for investigating issues with Java memory consumption: Native Memory Tracking, pmap, jemalloc, async-profiler.
Update
Here is a recording of my presentation Memory Footprint of a Java Process.
In this video, I discuss what may consume memory in a Java process, how to monitor and restrain the size of certain memory areas, and how to profile native memory leaks in a Java application.
Virtual Memory Usage from Java under Linux, too much memory used
This has been a long-standing complaint with Java, but it's largely meaningless, and usually based on looking at the wrong information. The usual phrasing is something like "Hello World on Java takes 10 megabytes! Why does it need that?" Well, here's a way to make Hello World on a 64-bit JVM claim to take over 4 gigabytes ... at least by one form of measurement.
java -Xms1024m -Xmx4096m com.example.Hello
Different Ways to Measure Memory
On Linux, the top command gives you several different numbers for memory. Here's what it says about the Hello World example:
  PID USER      PR  NI  VIRT  RES  SHR S %CPU %MEM    TIME+  COMMAND
 2120 kgregory  20   0 4373m  15m 7152 S    0  0.2   0:00.10 java
- VIRT is the virtual memory space: the sum of everything in the virtual memory map (see below). It is largely meaningless, except when it isn't (see below).
- RES is the resident set size: the number of pages that are currently resident in RAM. In almost all cases, this is the only number that you should use when saying "too big." But it's still not a very good number, especially when talking about Java.
- SHR is the amount of resident memory that is shared with other processes. For a Java process, this is typically limited to shared libraries and memory-mapped JARfiles. In this example, I only had one Java process running, so I suspect that the 7k is a result of libraries used by the OS.
- SWAP isn't turned on by default, and isn't shown here. It indicates the amount of virtual memory that is currently resident on disk, whether or not it's actually in the swap space. The OS is very good about keeping active pages in RAM, and the only cures for swapping are (1) buy more memory, or (2) reduce the number of processes, so it's best to ignore this number.
The situation for Windows Task Manager is a bit more complicated. Under Windows XP, there are "Memory Usage" and "Virtual Memory Size" columns, but the official documentation is silent on what they mean. Windows Vista and Windows 7 add more columns, and they're actually documented. Of these, the "Working Set" measurement is the most useful; it roughly corresponds to the sum of RES and SHR on Linux.
Understanding the Virtual Memory Map
The virtual memory consumed by a process is the total of everything that's in the process memory map. This includes data (eg, the Java heap), but also all of the shared libraries and memory-mapped files used by the program. On Linux, you can use the pmap command to see all of the things mapped into the process space (from here on out I'm only going to refer to Linux, because it's what I use; I'm sure there are equivalent tools for Windows). Here's an excerpt from the memory map of the "Hello World" program; the entire memory map is over 100 lines long, and it's not unusual to have a thousand-line list.
0000000040000000     36K r-x--  /usr/local/java/jdk-1.6-x64/bin/java
0000000040108000      8K rwx--  /usr/local/java/jdk-1.6-x64/bin/java
0000000040eba000    676K rwx--    [ anon ]
00000006fae00000  21248K rwx--    [ anon ]
00000006fc2c0000  62720K rwx--    [ anon ]
0000000700000000 699072K rwx--    [ anon ]
000000072aab0000 2097152K rwx--    [ anon ]
00000007aaab0000 349504K rwx--    [ anon ]
00000007c0000000 1048576K rwx--    [ anon ]
...
00007fa1ed00d000   1652K r-xs-  /usr/local/java/jdk-1.6-x64/jre/lib/rt.jar
...
00007fa1ed1d3000   1024K rwx--    [ anon ]
00007fa1ed2d3000      4K -----    [ anon ]
00007fa1ed2d4000   1024K rwx--    [ anon ]
00007fa1ed3d4000      4K -----    [ anon ]
...
00007fa1f20d3000    164K r-x--  /usr/local/java/jdk-1.6-x64/jre/lib/amd64/libjava.so
00007fa1f20fc000   1020K -----  /usr/local/java/jdk-1.6-x64/jre/lib/amd64/libjava.so
00007fa1f21fb000     28K rwx--  /usr/local/java/jdk-1.6-x64/jre/lib/amd64/libjava.so
...
00007fa1f34aa000   1576K r-x--  /lib/x86_64-linux-gnu/libc-2.13.so
00007fa1f3634000   2044K -----  /lib/x86_64-linux-gnu/libc-2.13.so
00007fa1f3833000     16K r-x--  /lib/x86_64-linux-gnu/libc-2.13.so
00007fa1f3837000      4K rwx--  /lib/x86_64-linux-gnu/libc-2.13.so
...
A quick explanation of the format: each row starts with the virtual memory address of the segment. This is followed by the segment size, permissions, and the source of the segment. This last item is either a file or "anon", which indicates a block of memory allocated via mmap.
Starting from the top, we have
- The JVM loader (ie, the program that gets run when you type
java). This is very small; all it does is load in the shared libraries where the real JVM code is stored. - A bunch of anon blocks holding the Java heap and internal data. This is a Sun JVM, so the heap is broken into multiple generations, each of which is its own memory block. Note that the JVM allocates virtual memory space based on the
-Xmxvalue; this allows it to have a contiguous heap. The-Xmsvalue is used internally to say how much of the heap is "in use" when the program starts, and to trigger garbage collection as that limit is approached. - A memory-mapped JARfile, in this case the file that holds the "JDK classes." When you memory-map a JAR, you can access the files within it very efficiently (versus reading it from the start each time). The Sun JVM will memory-map all JARs on the classpath; if your application code needs to access a JAR, you can also memory-map it.
- Per-thread data for two threads. The 1M block is the thread stack. I didn't have a good explanation for the 4k block, but @ericsoe identified it as a "guard block": it does not have read/write permissions, so will cause a segment fault if accessed, and the JVM catches that and translates it to a
StackOverFlowError. For a real app, you will see dozens if not hundreds of these entries repeated through the memory map. - One of the shared libraries that holds the actual JVM code. There are several of these.
- The shared library for the C standard library. This is just one of many things that the JVM loads that are not strictly part of Java.
The shared libraries are particularly interesting: each shared library has at least two segments: a read-only segment containing the library code, and a read-write segment that contains global per-process data for the library (I don't know what the segment with no permissions is; I've only seen it on x64 Linux). The read-only portion of the library can be shared between all processes that use the library; for example, libc has 1.5M of virtual memory space that can be shared.
When is Virtual Memory Size Important?
The virtual memory map contains a lot of stuff. Some of it is read-only, some of it is shared, and some of it is allocated but never touched (eg, almost all of the 4Gb of heap in this example). But the operating system is smart enough to only load what it needs, so the virtual memory size is largely irrelevant.
Where virtual memory size is important is if you're running on a 32-bit operating system, where you can only allocate 2Gb (or, in some cases, 3Gb) of process address space. In that case you're dealing with a scarce resource, and might have to make tradeoffs, such as reducing your heap size in order to memory-map a large file or create lots of threads.
But, given that 64-bit machines are ubiquitous, I don't think it will be long before Virtual Memory Size is a completely irrelevant statistic.
When is Resident Set Size Important?
Resident Set size is that portion of the virtual memory space that is actually in RAM. If your RSS grows to be a significant portion of your total physical memory, it might be time to start worrying. If your RSS grows to take up all your physical memory, and your system starts swapping, it's well past time to start worrying.
But RSS is also misleading, especially on a lightly loaded machine. The operating system doesn't expend a lot of effort to reclaiming the pages used by a process. There's little benefit to be gained by doing so, and the potential for an expensive page fault if the process touches the page in the future. As a result, the RSS statistic may include lots of pages that aren't in active use.
Bottom Line
Unless you're swapping, don't get overly concerned about what the various memory statistics are telling you. With the caveat that an ever-growing RSS may indicate some sort of memory leak.
With a Java program, it's far more important to pay attention to what's happening in the heap. The total amount of space consumed is important, and there are some steps that you can take to reduce that. More important is the amount of time that you spend in garbage collection, and which parts of the heap are getting collected.
Accessing the disk (ie, a database) is expensive, and memory is cheap. If you can trade one for the other, do so.
What is the largest possible heap size with a 64-bit JVM?
If you want to use 32-bit references, your heap is limited to 32 GB.
However, if you are willing to use 64-bit references, the size is likely to be limited by your OS, just as it is with 32-bit JVM. e.g. on Windows 32-bit this is 1.2 to 1.5 GB.
Note: you will want your JVM heap to fit into main memory, ideally inside one NUMA region. That's about 1 TB on the bigger machines. If your JVM spans NUMA regions the memory access and the GC in particular will take much longer. If your JVM heap start swapping it might take hours to GC, or even make your machine unusable as it thrashes the swap drive.
Note: You can access large direct memory and memory mapped sizes even if you use 32-bit references in your heap. i.e. use well above 32 GB.
Compressed oops in the Hotspot JVM
Compressed oops represent managed pointers (in many but not all places in the JVM) as 32-bit values which must be scaled by a factor of 8 and added to a 64-bit base address to find the object they refer to. This allows applications to address up to four billion objects (not bytes), or a heap size of up to about 32Gb. At the same time, data structure compactness is competitive with ILP32 mode.
How to increase maximum number of JVM threads (Linux 64bit)
You can use a sample program to find out the current threads limit.
If you encounter Exception in thread "main" java.lang.OutOfMemoryError: unable to create new native thread, check these:
In small memory machines
Every Java thread consume its own stack memory. Default stack size is 1024k (= 1M). You can reduce the stack size like
java -Xss512k .... JVM cannot be started if the stack size is too low.And beware heap memory configurations: (initial)
-Xmsand (maximum)-Xmx. The more memory is allocated to heap, the less available memory for stack.System limits
Some values in
ulimit -acan affect a thread limit.max memory size- unlimited on most 64bit machinesmax user processes- linux treats threads like processesvirtual memory- unlimited on most 64bit machines. virtual memory usage is increased by -Xss configuration (default 1024k)
You can change these values by (temporal) running
ulimitcommand or (permanent) editing/etc/security/limits.conf.sys.kernel.threads-maxThis value is the system-global (including non-JVM processes) maximum number of threads. Check
cat /proc/sys/kernel/threads-max, and increase if necessary.echo 999999 > /proc/sys/kernel/threads-max
orsys.kernel.threads-max = 999999in/etc/sysctl.confto change permanently.sys.kernel.pid_maxIf
cat /proc/sys/kernel/pid_maxis similar to current limit, increase this. Linux treats threads like processes.echo 999999 > /proc/sys/kernel/pid_max
orsys.kernel.pid_max = 999999in/etc/sysctl.confto change permanently.And you may need to increase
sys.vm.max_map_count, too.sys.vm.max_map_countcat /proc/sys/vm/max_map_countshould be at least (2 x thread-count).Attempt to protect stack guard pages failed.andOpenJDK 64-Bit Server VM warning: Attempt to deallocate stack guard pages failed.error messages are emitted by JavaThread::create_stack_guard_pages(), and it calls os::guard_memory(). In Linux, this function is mprotect().echo 1999999 > /proc/sys/vm/max_map_count
orsys.vm.max_map_count = 1999999in/etc/sysctl.confto change permanently.
How to use ulimit with java correctly?
It's really hard to effectively ulimit java. Many pools are unbounded, and the JVM fails catastrophically when an allocation attempt fails. Not all the memory is actually committed, but much of it is reserved thus counting toward the virtual memory limit imposed by ulimit.
After much investigation, I've uncovered many of the different categories of memory java uses. This answer applies to OpenJDK and Oracle 8.x on a 64-bit system:
Heap
This is the most well understood portion of the JVM memory. It is where the majority of your program memory is used. It can be controlled with the -Xmx and -Xms options.
Metaspace
This appears to hold metadata about classes that have been loaded. I could not find out whether this category will ever release memory to the OS, or if it will only ever grow. The default maximum appears to be 1g. It can be controlled with the -XX:MaxMetaspaceSize option. Note: specifying this might not do anything without also specifying the Compressed class space as well.
Compressed class space
This appears related to the Metaspace. I could not find out whether this category will ever release memory to the OS, or if it will only ever grow. The default maximum appears to be 1g. It can be controlled with the '-XX:CompressedClassSpaceSize` option.
Garbage collector overhead
There appears to be a fixed amount of overhead depending on the selected garbage collector, as well as an additional allocation based on the size of the heap. Observation suggests that this overhead is about 5% of the heap size. There are no known options for limiting this (other than to select a different GC algorithm).
Threads
Each thread reserves 1m for its stack. The JVM appears to reserve an additional 50m of memory as a safety measure against stack overflows. The stack size can be controlled with the -Xss option. The safety size cannot be controlled. Since there is no way to enforce a maximum thread count and each thread requires a certain amount of memory, this pool of memory is technically unbounded.
Jar files (and zip files)
The default zip implementation will use memory mapping for zip file access. This means that each jar and zip file accessed will be memory mapped (requiring an amount of reserved memory equal to the sum of file sizes). This behavior can be disabled by setting the sun.zip.disableMemoryMapping system property (as in -Dsun.zip.disableMemoryMapping=true)
NIO Direct Buffers
Any direct buffer (created using allocateDirect) will use that amount of off-heap memory. The best NIO performance comes with direct buffers, so many frameworks will use them.
The JVM provides no way to limit the total amount of memory allowed for NIO buffers, so this pool is technically unbounded.
Additionally, this memory is duplicated on-heap for each thread that touches the buffer. See this for more details.
Native memory allocated by libraries
If you are using any native libraries, any memory they allocate will be off-heap. Some core java libraries (like java.util.zip.ZipFile) also use native libraries that consume-heap memory.
The JVM provides no way to limit the total amount of memory allocated by native libraries, so this pool is technically unbounded.
malloc arenas
The JVM uses malloc for many of these native memory requests. To avoid thread contention issues, the malloc function uses multiple pre-allocated pools. The default number of pools is equal to 8 x cpu but can be overridden by setting the environment variable MALLOC_ARENAS_MAX. Each pool will reserve a certain amount of memory even if it's not all used.
Setting MALLOC_ARENAS_MAX to 1-4 is generally recommend for java, as most frequent allocations are done from the heap, and a lower arena count will prevent wasted virtual memory from counting towards the ulimit.
This category is not technically it's own pool, but it explains the virtual allocation of extra memory.
Related Topics
Swing Gui Listeners Without Awt
How to Create a Generic Array in Java
Int Division: Why Is the Result of 1/3 == 0
How Do Servlets Work? Instantiation, Sessions, Shared Variables and Multithreading
Retain Precision With Double in Java
Mocking Static Methods With Mockito
How to Use the Tostring Method in Java
Integer Division: How to Produce a Double
Element Myelement Is Not Clickable At Point (X, Y)... Other Element Would Receive the Click
How to Get the Path of a Running Jar File
Why Don't Java'S +=, -=, *=, /= Compound Assignment Operators Require Casting
Error Java.Lang.Outofmemoryerror: Gc Overhead Limit Exceeded
How to Append Text to an Existing File in Java
How to Use Java.Util.Scanner to Correctly Read User Input from System.In and Act on It