Use a loop to plot n charts Python
Ok, so the easiest method to create several plots is this:
import matplotlib.pyplot as plt
x=[[1,2,3,4],[1,2,3,4],[1,2,3,4],[1,2,3,4]]
y=[[1,2,3,4],[1,2,3,4],[1,2,3,4],[1,2,3,4]]
for i in range(len(x)):
    plt.figure()
    plt.plot(x[i],y[i])
    # Show/save figure as desired.
    plt.show()
# Can show all four figures at once by calling plt.show() here, outside the loop.
#plt.show()
Note that you need to create a figure every time or pyplot will plot in the first one created.
If you want to create several data series all you need to do is:
import matplotlib.pyplot as plt
plt.figure()
x=[[1,2,3,4],[1,2,3,4],[1,2,3,4],[1,2,3,4]]
y=[[1,2,3,4],[2,3,4,5],[3,4,5,6],[7,8,9,10]]
plt.plot(x[0],y[0],'r',x[1],y[1],'g',x[2],y[2],'b',x[3],y[3],'k')
You could automate it by having a list of colours like ['r','g','b','k'] and then just calling both entries in this list and corresponding data to be plotted in a loop if you wanted to. If you just want to programmatically add data series to one plot something like this will do it (no new figure is created each time so everything is plotted in the same figure):
import matplotlib.pyplot as plt
x=[[1,2,3,4],[1,2,3,4],[1,2,3,4],[1,2,3,4]]
y=[[1,2,3,4],[2,3,4,5],[3,4,5,6],[7,8,9,10]]
colours=['r','g','b','k']
plt.figure() # In this example, all the plots will be in one figure.
for i in range(len(x)):
    plt.plot(x[i],y[i],colours[i])
plt.show()
17 Dec 2019: added plt.show() and plt.figure() calls to clarify this part of the story.
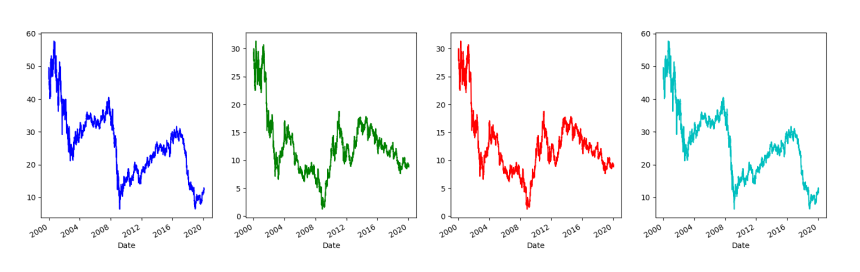
How to plot charts side by side with a forloop
Here i have used the plot function of dataframe, Also i like plotting in different colors so i do this small trick.
#CODE
import pandas as pd
from pandas import datetime
from pandas import DataFrame as df
import matplotlib
from pandas_datareader import data as web
import matplotlib.pyplot as plt
import datetime
import numpy as np

colors = ["b",'g','r','c','m','y','k']

stocks = 'GE','F' #<-- In this case there are just 2 symbols but this could be more
start = datetime.date(2000,1,1)
end = datetime.date.today()

data = web.DataReader(stocks, 'yahoo',start, end)

# THIS MAKES A GRID OF 1 ROW and len(stocks) COLUMN and figure size as (width, height) in inches.
fig, axs = plt.subplots(1, len(stocks), figsize=(30, 5))
i = 0

#iterate for each stock
for stock in stocks:
    # i'th close stock will plot on i'th axs (Note: Whatever be your grid)
    data["Close"][stock].plot(ax=axs[i],color=colors[i%len(colors)])
    i += 1

#show plot
plt.show()
Creating multiple plots with for loop?
By default, seaborn.barplot() plots data on the current Axes. If you didn't specify the Axes to plot on, the latter will override the previous one. To overcome this, you can either create a new figure in each loop or plot on a different axis by specifying the ax argument.
import matplotlib.pyplot as plt


for df in dfs:
    data = dfs[df].head(n=10)
    plt.figure() # Create a new figure, current axes also changes.
    sns.barplot(data=data, x='x_col', y='y_col', color='indigo').set_title(df)
Plotting multiple figures in a loop
Try the following:
import matplotlib.pyplot as plt
import numpy as np

x = np.arange(0,10)
y = np.arange(0,10)

for _ in range(2):
   plt.figure() # add this statement before your plot
   plt.plot(x,y)
   plt.show()
For loop for plotting multiple plots in matplotlib
Just put plt.show() in your routine:
for symbol in symbols:
    data = con.get_candles(symbol, period='D1', start = start, end = end)
    data1 = con.get_candles('USOil', period='D1', start = start1, end = end)
    ax = data['bidclose'].plot()
    data1['bidclose'].plot(ax=ax)
    plt.show()
Related Topics
How to Allocate Array With Shape and Data Type
Pandas Populate New Dataframe Column Based on Matching Columns in Another Dataframe
Converting Pandas Column of Comma-Separated Strings into Integers
How to Check Whether a Number Is Divisible by Another Number
Easiest Way to Convert Two Columns to Python Dictionary
Redirect Command Line Results to a Tkinter Gui
Python List from Database Table into a Dictionary
How to Get Text from Span Tag in Beautifulsoup
Python Pandas - Get Row Based on Previous Row Value
How to Clear Only Last One Line in Python Output Console
How to Convert Python Code to Application
Python - Automatically Adjust Width of an Excel File'S Columns
How to Skip Specific Indexes in an Array
Valueerror: Cannot Reshape Array of Size 30470400 into Shape (50,1104,104)
How to Select Last Row and Also How to Access Pyspark Dataframe by Index